.png)

We are taking project analytics to the next level—in this second phase of memoQ TMS’ Business Analytics, users gain the ability to create and visualize advanced, fully customizable reports for their localization projects.
These dynamic reports allow project managers to analyze and share vital project data with ease. Whether it's comparing total and weighted counts or diving into detailed graphs based on quantitative data, memoQ 10.2's Business Analytics dashboard empowers users to extract key project insights with just a few clicks.
Let’s dive into memoQ's new advanced reporting feature and what it means for your localization strategy.
Data-driven Localization at the Heart of your Strategy
"The art of communication is the language of leadership.” James Humers’ quote sums it up perfectly why you need to up your communication game when you want to take your business global.
Did you know that 76% of customers are more likely to make a purchase if there is information available in their mother tongue? Tailoring your communication to not only the language spoken by your target audience but also by adapting your content to local audiences’ expectations can greatly increase awareness, sales, and ROI.
Once you have decided to use localization in your globalization efforts, the next step is to create a strategy that aligns with your business goals—meaning that you have to be able to make informed decisions based on your goals. To make that happen, a data-driven localization approach is needed.
Based on user testimonials, up to 90% increase in productivity can be expected when using a translation management system (TMS). Understanding how much work has been done in a project and how much time and money has been saved by using memoQ TMS is the basis of your data-driven approach when it comes to localization—and that is what memoQ’s new feature is all about.
Analytics and measurement in the localization industry
When it comes to localization strategies, there is no out-of-the-box solution. No two businesses are the same, and thus, your strategy will be unique, in line with your specific goals in mind, and tailored to your needs.
The basis of analytics when it comes to your localization workflow is measurement, and reports on your metrics. Your reports must be clear on what the data represents as well as easy to understand for various stakeholders in your company who are responsible for decision making concerning localization efforts.
When developing memoQ TMS’ Business Analytics, we reached out to different LSPs, enterprises, and localization departments to make sure that we create the most versatile, customizable solution that could fit any company’s requirements when it comes to data and reporting.
memoQ Business Analytics: The Perfect Tool for Data-driven Localization
The first version of memoQ Business Analytics was rolled out in memoQ 9.10. In this version, you could create custom reports on your localization projects, and then download a .csv file containing information about your various memoQ projects (such as source, client, translator, deadlines, and more). You could then apply your own analytics tool to the .csv file to get the insights that you needed.
Business Analytics contains information on the following aspects of localization:
- Project data: project, client, subject, domain
- Source information about the documents: creation date, who it is from, whether it comes from a content connector etc.
- Import/export data
- File names and extensions
- Document size, word count
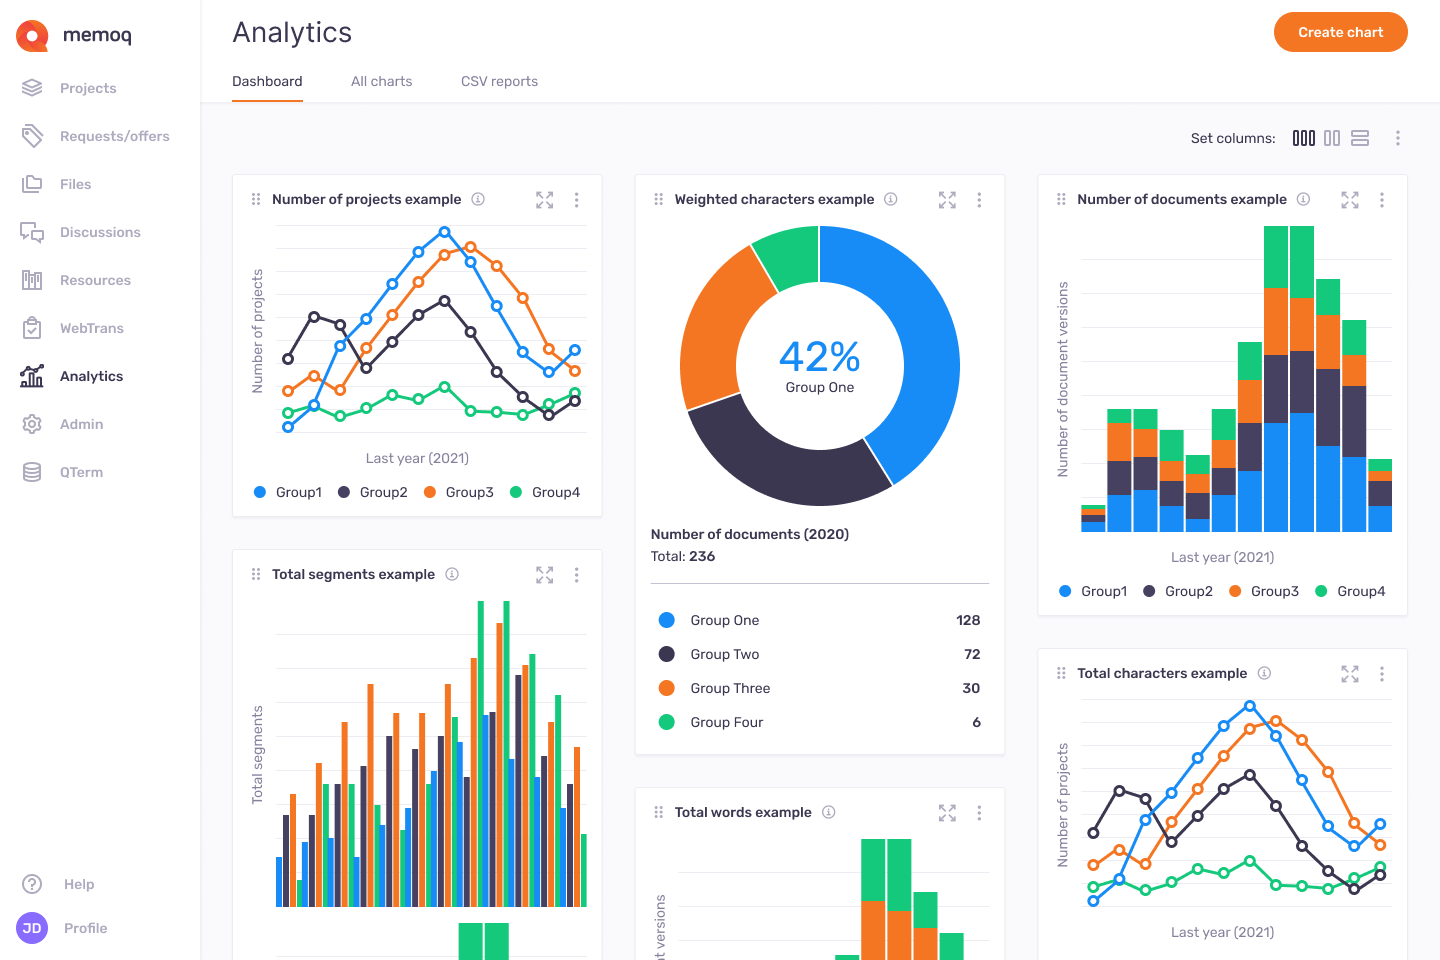
In memoQ 10.2, we are launching the second phase, which allows you to build and visualize advanced and highly customizable reports for your localization projects. Your visualized data is accessible through your Dashboard in the form of charts, which you can customize, update, and share with other users. The date when the report was created is also reflected on the Dashboard, so you can organize and search your reports as needed.
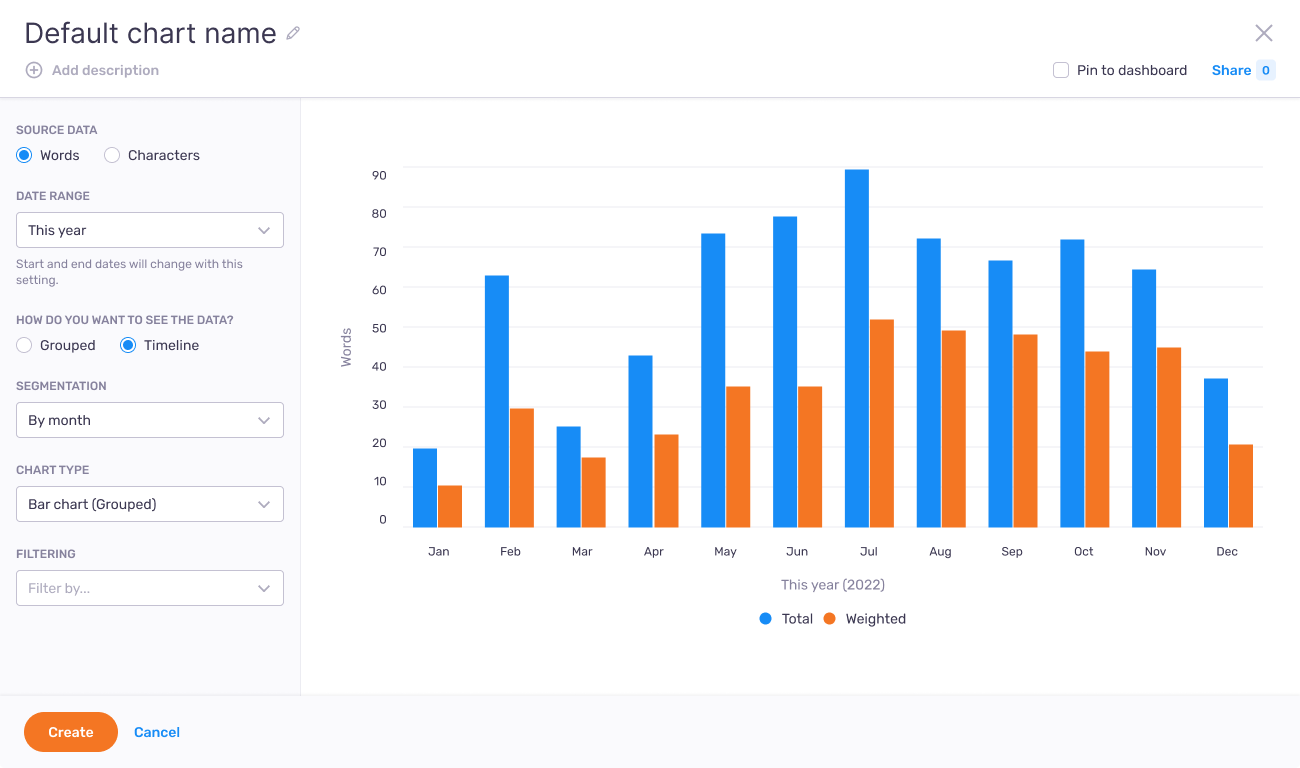
In your reports, you can choose whether you would like to compare total and weighted counts (leverage data), or detailed graphs based on quantitative data (volume data). Key project insights are accessible within a few clicks in the Business Analytics dashboard.
What does this mean to your data-driven localization strategy?
By accessing these insights directly within memoQ TMS, you can take your strategy to the next level. With the custom charts and reports, it is also easier for project managers to report on different localization projects to decision makers. This leads to a more refined strategy where you can also make adjustments to your localization efforts as you go, translating into better return on investments and more informed decisions on future localization projects.
With the visual representation, you can also access project information at a glance, analyze past performance, and compare and adjust projects based on any of the data available in your charts.
Practical information on memoQ Business Analytics
- The data used is live, and your reports reflect a certain point in time. You can refresh data automatically at certain times or manually. If you want a report based on a different time period, you will have to create a new one.
- Once you created a report, you can change its settings, and you can share it with other users. They will be able to view the chart containing up-to-date data, and even add it to their own Dashboard, but cannot change or delete them.
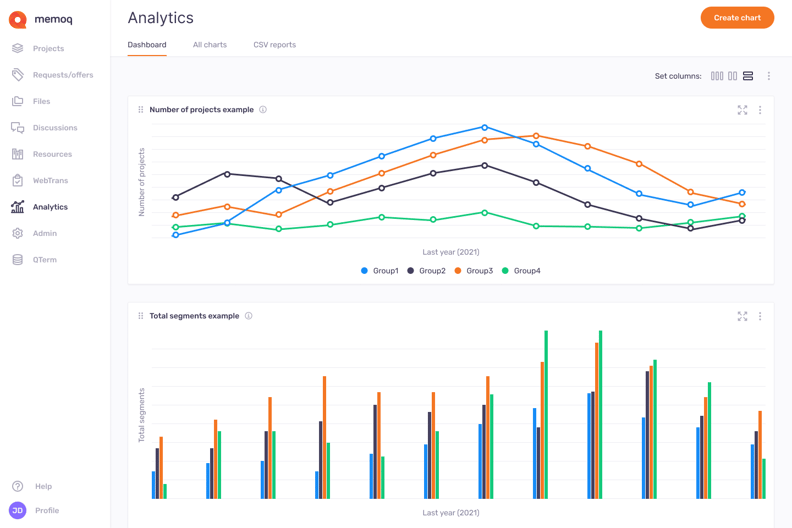
- The Dashboard is a collection of cards with a small version of the chart itself. Each user can have their own, which they can organize to their liking.
memoQ Business Analytics covers most of the analytics and reporting needs of LSPs and enterprises; however, if you need more advanced functionality, you can still rely on a Business Management System provider.
Discover Business Analytics in our upcoming webinar!

Ready to get started with data-driven localization with custom reports? Book a free consultation with our team, or discover memoQ TMS here!
.png)